Do you want to optimise your app so it run faster? Just read this.
But hang on… there’s so much information! You could spend weeks optimising your app for nothing!
Stop The Guesswork!!!
Most people guess at what’s slow, based on their previous experience. The problem is it’s so easy to be wrong, and you can waste a huge amount of time fixing the wrong stuff. So how do you take the guesswork out and start making an actual, measurable difference?
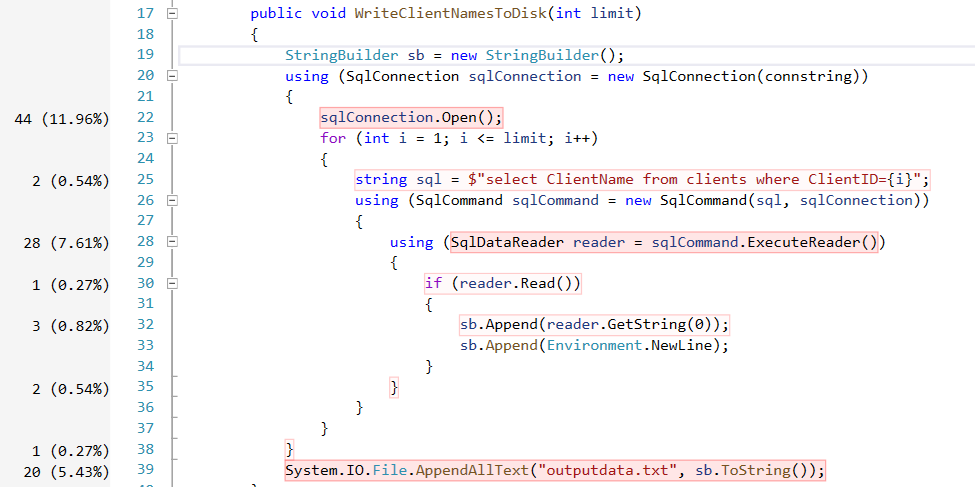
Let’s take this c# code sample:
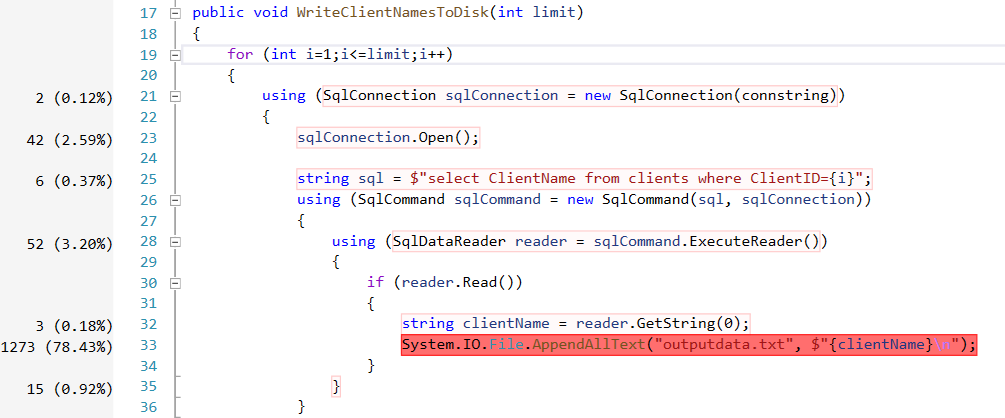
public void WriteClientNamesToDisk(int limit)
{
    for (int i=1;i<=limit;i++)
    {
        using (SqlConnection sqlConnection = new SqlConnection(connstring))
        {
            sqlConnection.Open();

            string sql = $"select Name from Clients where ClientID={i}";

            using (SqlCommand sqlCommand = new SqlCommand(sql, sqlConnection))
            {
                using (SqlDataReader reader = sqlCommand.ExecuteReader())
                {
                    if (reader.Read())
                    {
                        string clientName = reader.GetString(0);
                        System.IO.File.AppendAllText("outputdata.txt", $"{i}: {clientName}\n");
                    }
                }
            }
        }
    }
}
There’s a few performance problems here. Where would you start to optimise it? What do you think is slow?
Yes, it’s a trick question. There’s no way to tell what’s actually slow in this function without running it! It might be opening the database connection that’s slow. It might be reading the data from the database that’s slow. You might have a slow hard disk, and it might be that suspicious AppendAllText statement.
Let’s take the guesswork out! Can you see this option in visual studio?

Hit it, then tick “Instrumentation” (untick other options first if disabled):
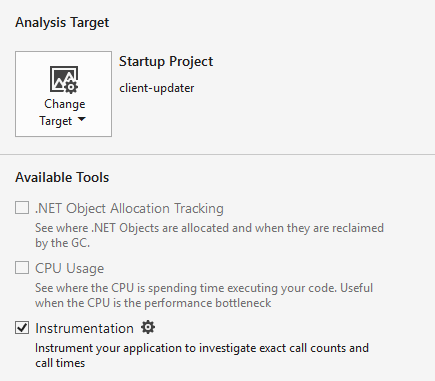
And crucially, make sure your current configuration is set to Release:

Click the Start button, and wait for the profiler to do it’s thing. BTW, sometimes the profiler fails to work. Just run it again.
So I wonder which function is the slowest?
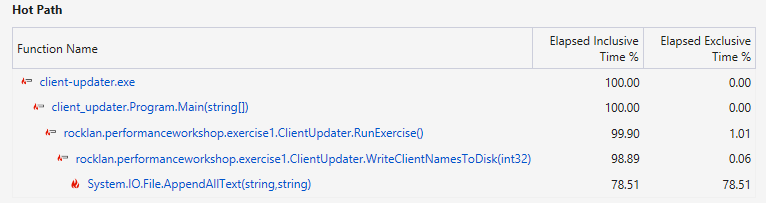
So our WriteClientNamesToDisk() function is taking up 98% of the execution time. Fair enough, it’s our only function. But hang on, System.IO.File.AppendAllText() is taking 78%? Wow. I wonder which functions are doing the most individual work?

Wow, that AppendAllText() is a killer. Surprisingly enough, the DbConnection.Open() is only taking up 2% of the runtime! Even though we’re doing it in a loop! (I am guessing the connection pooling is really helping us out here). So in other words, if we spent a lot of time optimising the database connections we would only get, at maximum, a 2% speed increase. Wow. If you guessed “It’s obviously the database connections” you were wrong :)
But that’s only half the story. You need to test in as close to production-like environment as possible. What if my production database is actually on the other side of the world & under heavy load? I would expect to see the connections start to slow things down. But that’s just a guess! You need to prove it otherwise you’re wasting your time.
Checking CPU Usage
Before we do any coding, let’s get some more lower grained stats. Open the Performance Profiler again, and this time check “CPU Usage”:
Kick it off, and what do we get?
Yep. That AppendAllText is killing us. Let’s move it to be outside of the loop and run the profiler again. What do we get this time?
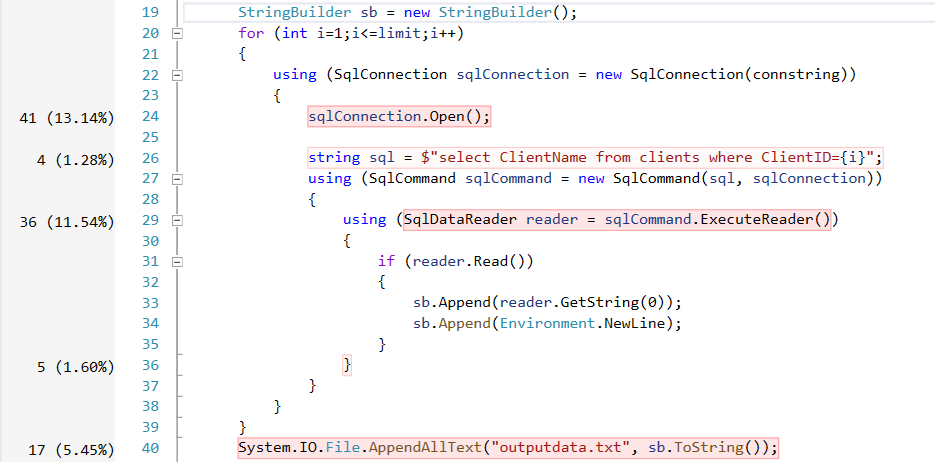
Wow! It’s only taking up 5% of total execution time now, what a massive improvement! Of course this has sacrificed memory usage for performance… if memory was at a premium, eg maybe you were running this in an azure function which charged you for memory allocations, maybe this change wouldn’t be so good! But in this case, if we were only pulling back a few hundred clients at a time, I’d say it’s a great trade off. So looking at the above example, what needs to be improved next? Well, that pesky sqlConnection.Open() is taking up 13% of the runtime. That doesn’t need to be in the loop either. Let’s take it out.
Not much of a difference there. What about the ExecuteReader command? Maybe that’s slow because we’re constructing a new SqlCommand object each time, what about we take that out of the loop and just set a parameter each time we call it?
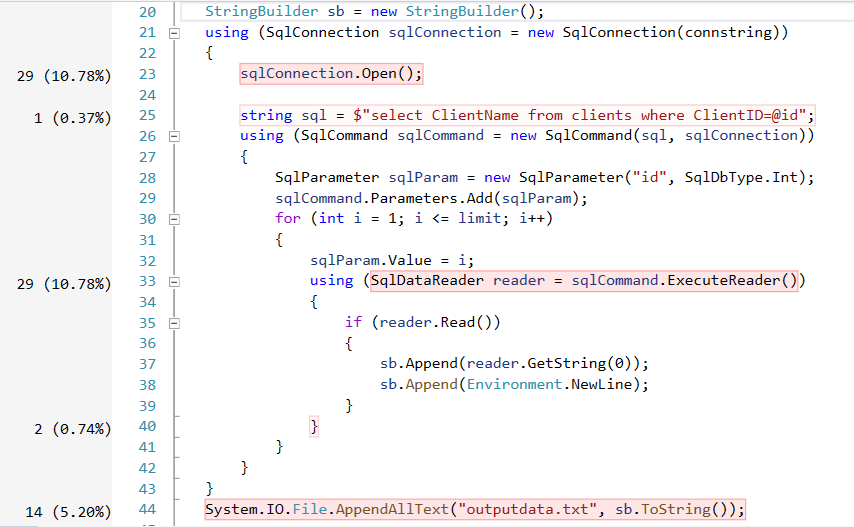
Didn’t seem to make much of a difference here. Possibly still a bit of an improvement long term, as we’re allocation less objects on the stack. But in terms of raw performance, there’s no proof that this fixed anything.
But hang on… why are we performing an individual select statement for each client? Why not pull them all back in one go?
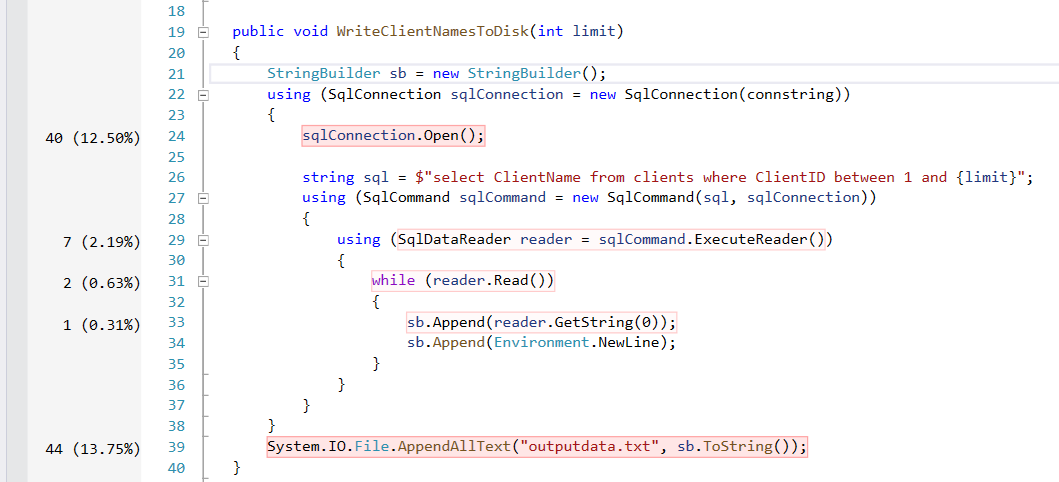
Wow! The connection open and the append text are taking up 26% of the time.. and reading the data from the database is taking up just 3%! I actually even had to call this function hundreds of times in a loop in order to collect this data, otherwise the percentage was so tiny it was immeasurable compared to the rest of the app - mostly the application startup!
I hope I’ve made my point. Micro optimisations are a massive waste of time. You need to focus where the important stuff is, and you need to look at your broader architecture if you really want to make a difference.
So wait, what's slow again?
Even though I want you to use the profiler like there’s no tomorrow, it’s still helpful to have in the back of your mind what kind of thing will generally slow you down, so that you can avoid writing badly performing code in the first place. So what’s a real killer? Let’s start with the most likely candidates:
- Disk Access
- Database Access
- Web Services
These are all external systems that are outside of your control. You might be able to write a super fast bit of code that calculates PI to the millionth decimal place, but if you need to ask a web service to do this for you… you have no control over how long it might take to finish. Reduce these calls and avoid unless absolutely neccesary!
So what's slow in my own c# code?
Once you’ve got calls to external stuff out of the way, you might need to start looking at your own code. What do you want to avoid?
- Reflection
- Exceptions
- Garbage Collection
- Incorrect data types
That a good starting point. Garbage collection covers a massive array of things. From the classic string concatenation in a loop, to the abuse of creating List<object>’s everywhere when a simple IEnumerable<object> would do. There’s a whole world of optimisations you can do about reducing the number of objects you allocate, but ultimately it all comes down to a simple fact:
Fast code is code that doesn't run
Do you really need to call the web service again? Can you cache the result and avoid another call? Do you really need to allocate an object inside your function? Can it be moved to a constructor? Do you really need to call .ToList() or can you just use the enumerator?
Now you need to start reading Microsoft’s Performance Best Practices at a Glance. But don’t do them all unless you need to :)